Go-Micro框架使用runtime/pprof进行性能分析
目录
背景
公司最近在做520大促前压测系统瓶颈,因为公司用的是Go-Micro框架,框架底层由其他团队负责更新维护,net/http/pprof包不能用,所以研究了下runtime/pprof的使用
实操
Step1. main函数外申明需要分析生成的cpu和mem默认文件名的全局变量
var cpuprofile = flag.String("cpuprofile", "cpu.prof", "write cpu profile `file`")
var memprofile = flag.String("memprofile", "mem.prof", "write memory profile to `file`")
Step2. main函数内头部开启pprof
    flag.Parse()
	if *cpuprofile != "" {
		f, err := os.Create(*cpuprofile)
		if err != nil {
			log.Errorf("could not create CPU profile: ", err)
		}
		if err := pprof.StartCPUProfile(f); err != nil {
			log.Errorf("could not start CPU profile: ", err)
		}
		defer pprof.StopCPUProfile()
	}

	if *memprofile != "" {
		f, err := os.Create(*memprofile)
		if err != nil {
			log.Errorf("could not create memory profile: ", err)
		}
		runtime.GC() // get up-to-date statistics
		if err := pprof.WriteHeapProfile(f); err != nil {
			log.Errorf("could not write memory profile: ", err)
		}
		f.Close()
	}
Step3. 启动Go-Micro服务,pprof就会搜集你系统的消耗,项目根目录下会生成cpu.prof和mem.prof两个分析文件
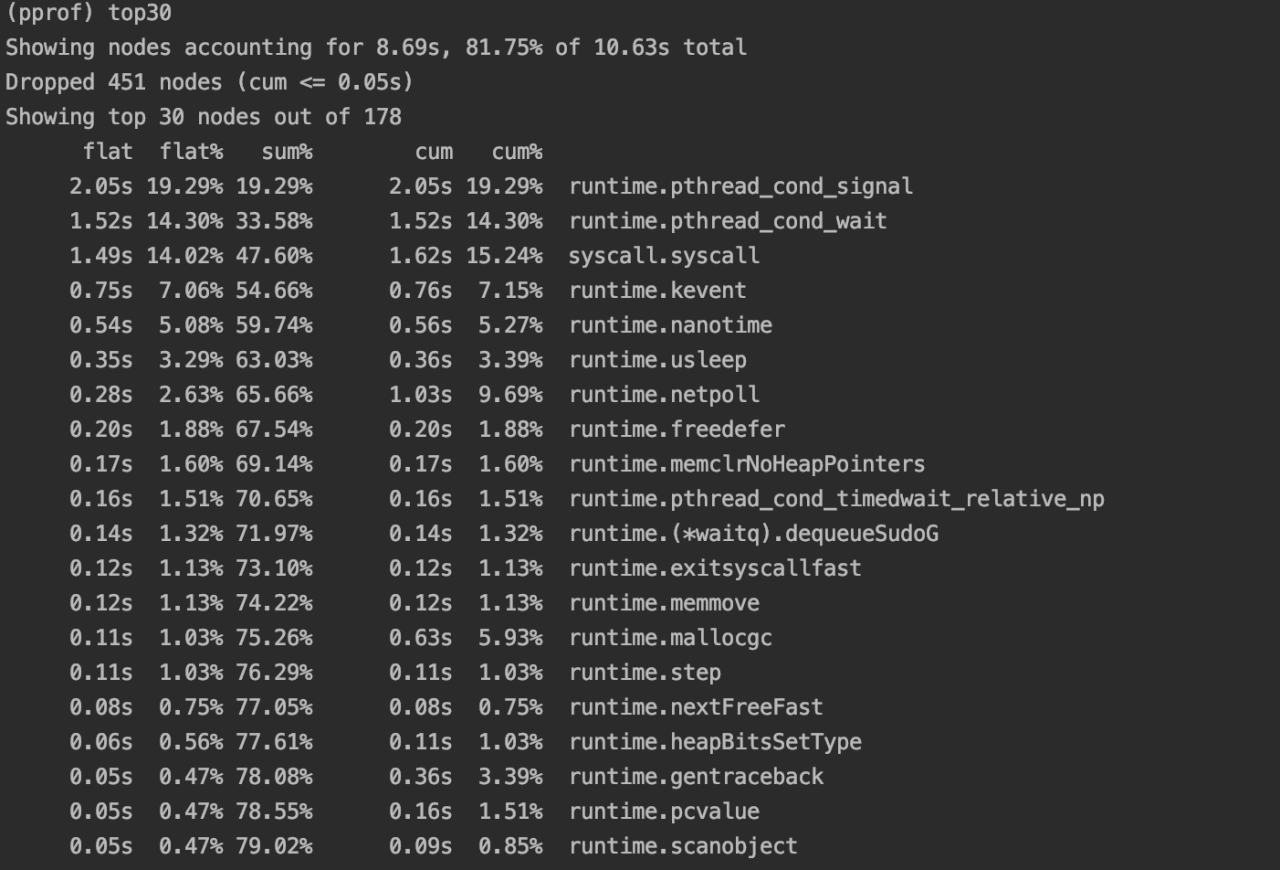
Step4. 输入go tool pprof cpu.prof进入到分析界面,输入top30查看耗费性能最多的记录逐一分析